Skaffold
Running the project with skaffold
Prerequisites
Before you can get going with skaffold you need to edit one file first to add your bot token
- Obtain a bot token from your chat service (Discord, Slack, etc)
-
base64encode the token so it can be saved as a k8s secretpython3 script/base64string.py --string supersecretvalue -
From the root of this repo, edit the following file:
script/k8s/errbot/secret.yaml.example- Add your base64 encoded bot token to the file like so:
CHAT_SERVICE_TOKEN: "base64encodedvaluehere==" - Rename the file to
secret.yaml - ⚠️ Ensure you don't commit this file as it has your secret token!
- Add your base64 encoded bot token to the file like so:
Steps
-
Start your minikube cluster, configure skaffold, and set your Docker context:
minikube start --profile custom skaffold config set --global local-cluster true eval $(minikube -p custom docker-env) -
Start your cluster with skaffold:
skaffold devOptionally, run
skaffold dev --tail=trueto attach to your running containers to view log output while they run
Minikube Dashboard
The first thing you may want to do is connect to your minikube instance via the dashboard UI.
Enable the k8s dashboard by running the following command in a seperate terminal window:
minikube dashboard --profile custom
Grafana
Now that your cluster is up and running, you can get to your Grafana instance for metrics, logs, etc by doing the following:
- Open a new terminal window
-
Obtain your Grafana password (the username will be
admin):kubectl get secret --namespace observability grafana -o jsonpath="{.data.admin-password}" | base64 --decode ; echo -
Port forward to your grafana instance:
kubectl port-forward --namespace observability service/grafana 3000:80If your IDE does not automatically direct you, simply go to http://127.0.0.1:3000/login after port forwarding with
kubectl -
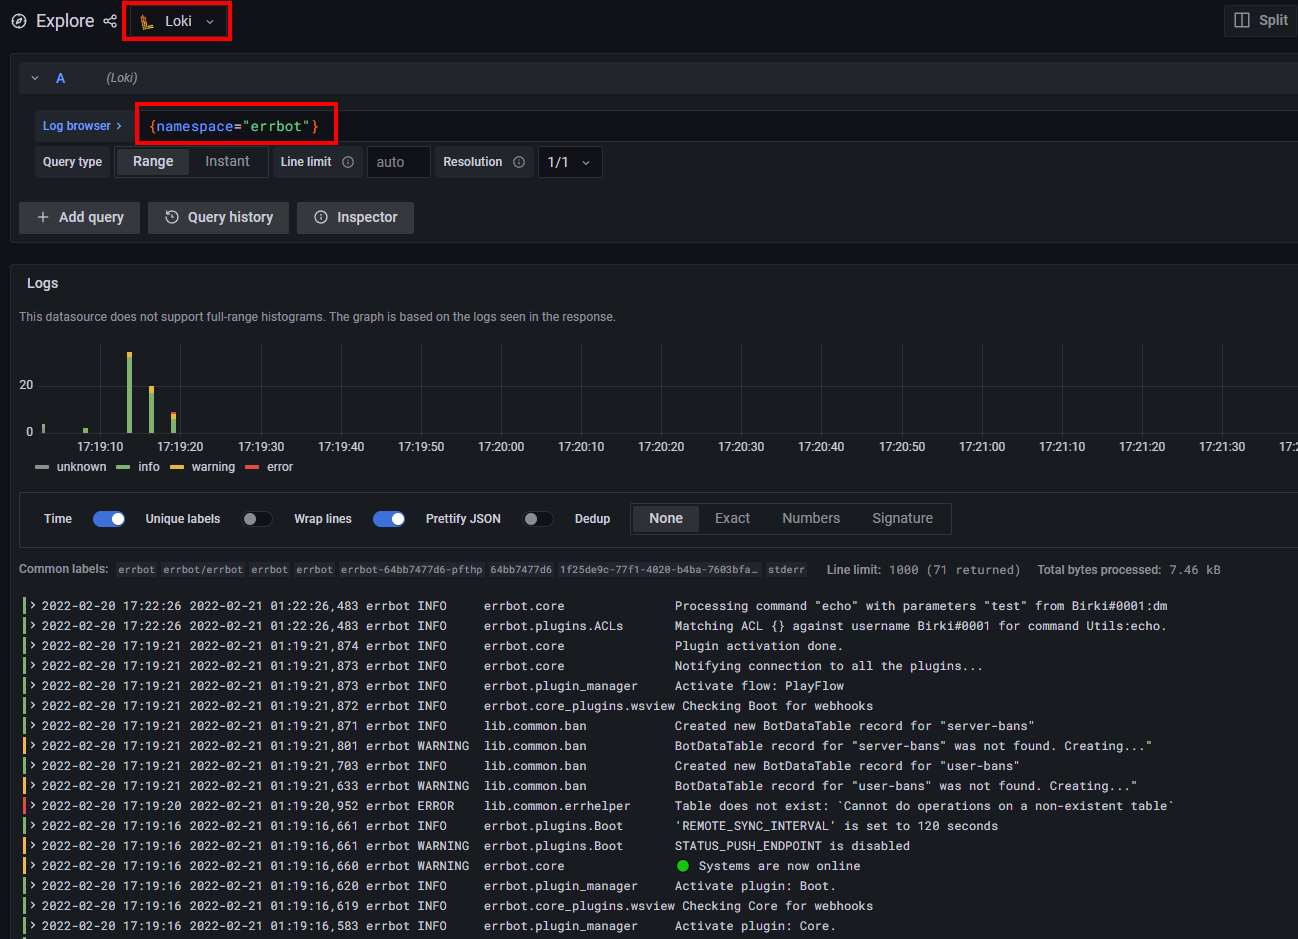
Sign in with the credentials obtained in step two and navigate to the explore tab in Grafana
-
Run a query like the one below to view your
errbotcontainer logs in real time!